 Which also proves that my 12'' display is to small at least for some things :-).
Update: pygrind is available under the MIT license.
Which also proves that my 12'' display is to small at least for some things :-).
Update: pygrind is available under the MIT license.

Friday, December 14, 2007
Profiling for fun with valgrind
Recently I've been doing a lot of profiling on the PyPy executables to find speed bottlenecks. Valgrind (the original page seems to be down) is an extremely nice tool for doing this. It has several built-in tools that give you different types of profiles. The callgrind mode provides you with a lot of information including relative call costs. The cachegrind tool gives you less information, but what it gives you (e.g. cache misses) is much more accurate. The obvious choice would be to have a way to combine the results of two profiling runs to have both. In the last days I wrote a script that does this. It's available at my user's svn and has a pretty intuitive command line interface. The combining calculation are not perfect yet, total costs of functions can still be a bit bogus (they can sum up to whatever) but at least the relative figures are good. This means that we can stop looking at two different types of graphs now.
An awesome tool for analyzing the profile data is kcachegrind.
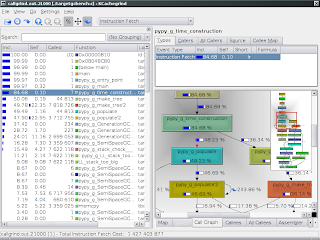 Which also proves that my 12'' display is to small at least for some things :-).
Update: pygrind is available under the MIT license.
Which also proves that my 12'' display is to small at least for some things :-).
Update: pygrind is available under the MIT license.
Which also proves that my 12'' display is to small at least for some things :-).
Update: pygrind is available under the MIT license.
Posted by
Maciej Fijalkowski

Subscribe to:
Post Comments (Atom)
4 comments:
Nice!
In what license are you releasing pygrind? I would like to integrate pygrind's code into Gprof2Dot (LGPL) to be able to generate nice-looking graphs from cachegrind output.
Indeed, good question, thanks. I've updated blog post (I think it satisfies you, if not you can have it under LGPL if you like).
Excellent. Thanks!
If you like kcachegrind, you might like using it for profiling python:
http://ddaa.net/blog/python/lsprof-calltree
Post a Comment